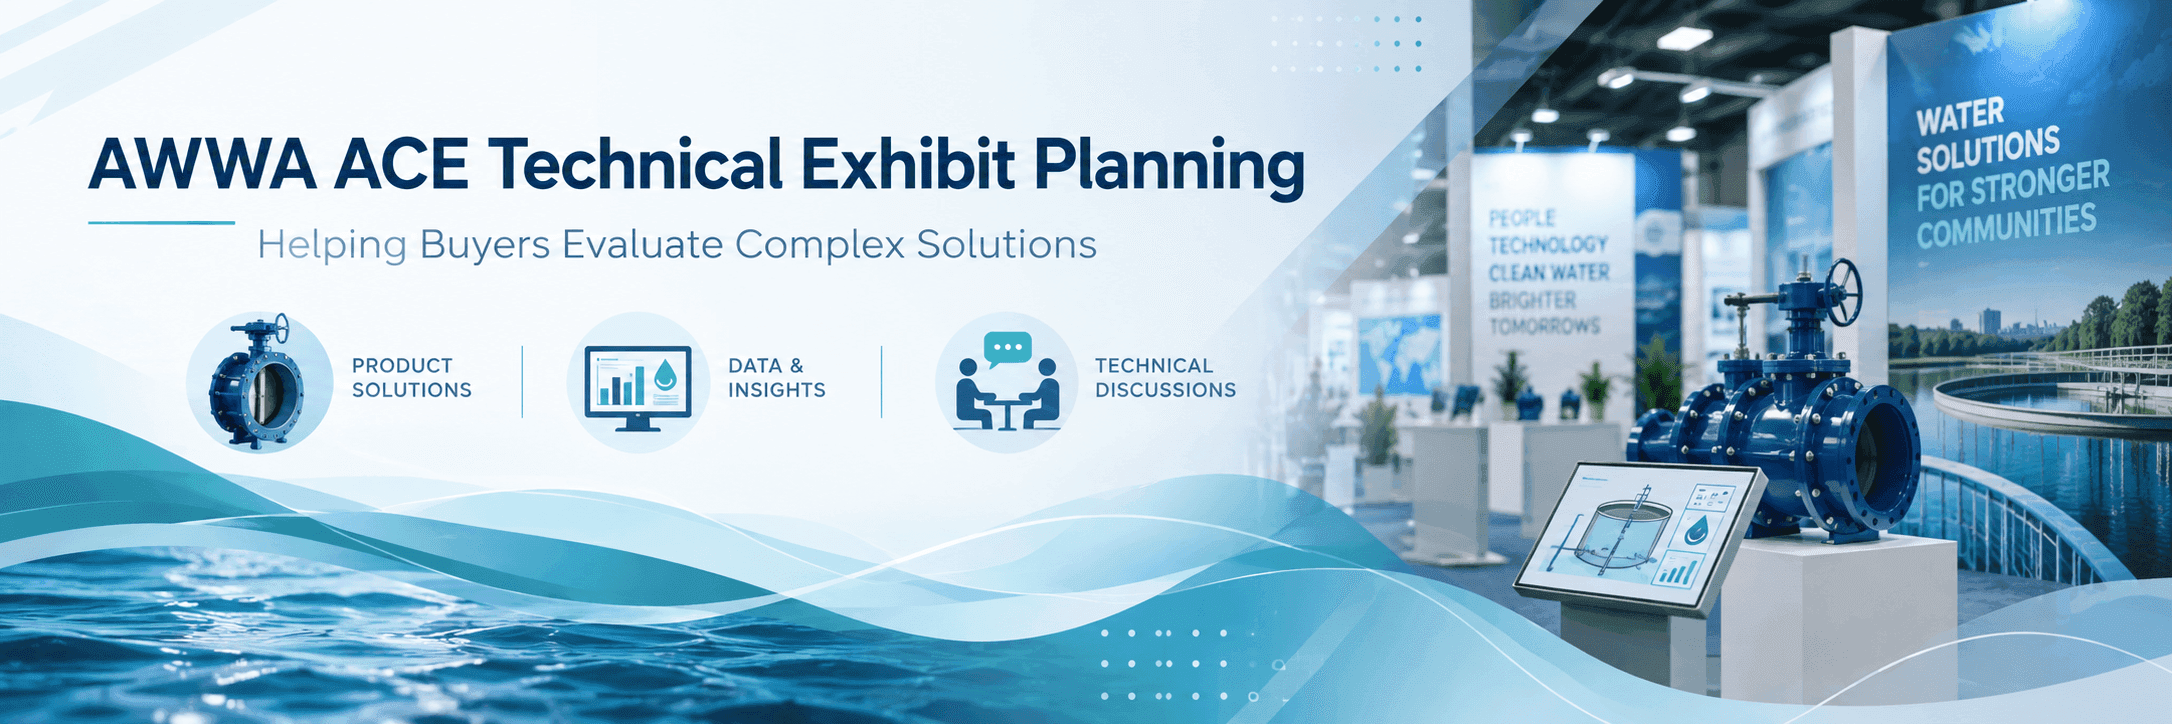
AWWA ACE Smart Water Monitoring Workflow Demo Booth Planning


How should exhibitors plan a smart water monitoring demo booth at AWWA ACE?
Build an AWWA ACE monitoring demo around one utility problem the product can demonstrate reliably. Show where the data comes from, what changes on the dashboard, why an alert appears, and what an operator could investigate next. Arrange screens and visitor positions around that sequence, with room for technical questions. Test the live setup and an accurately labeled backup before opening.
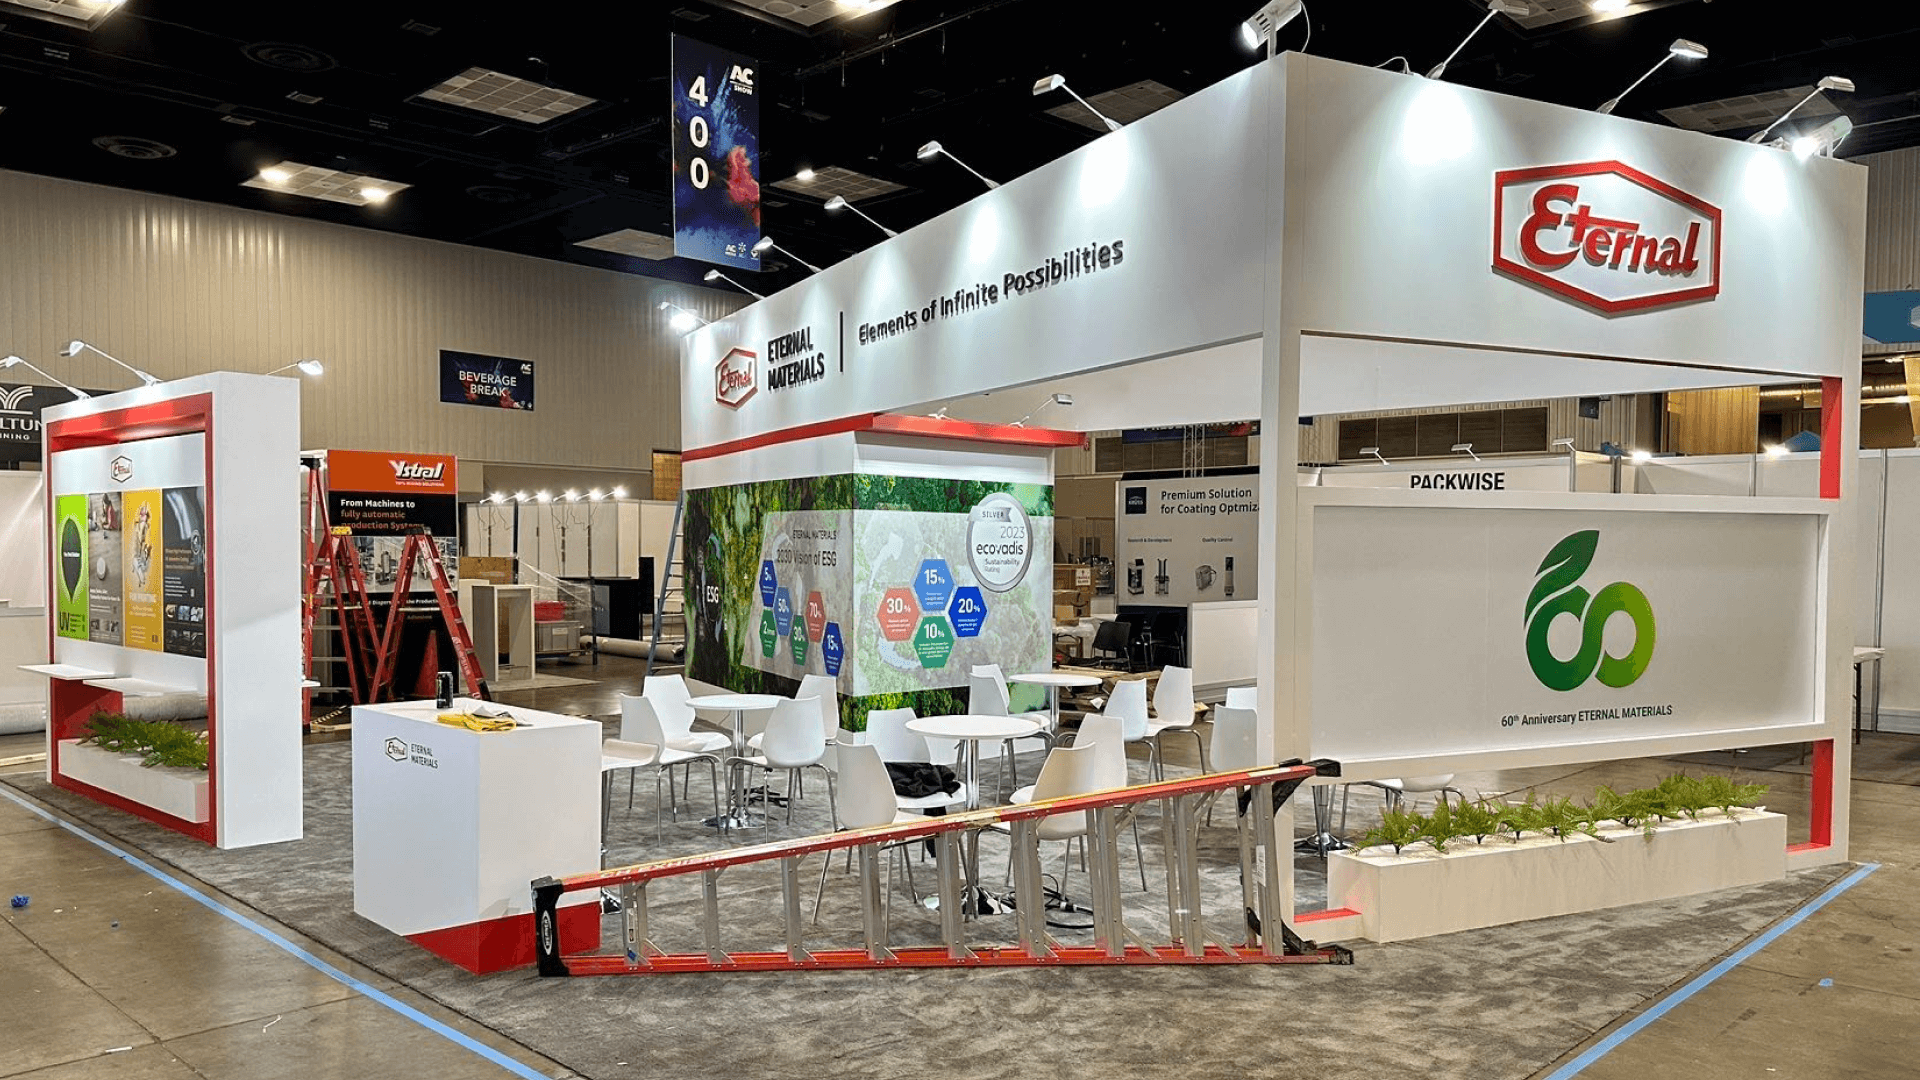
A utility operator reviewing pressure monitoring needs to know more than whether a dashboard looks polished. The demonstration should identify the source of a reading, show a meaningful change, explain an alert, and lead to a practical question about system response. A 10x20 booth may be enough for one guided workflow. A 20x20 layout becomes useful when that demonstration must continue while another buyer discusses integration or a pilot.
A sensor sample, focused dashboard, and clear operating scenario can tell that story without filling the booth with screens. Use a pressure anomaly, leakage warning, or asset-condition example only when the exhibitor's product can support it. The booth layout should still align with the broader exhibit decisions covered in AWWA ACE booth planning, including buyer priorities, display functions, and overall configuration.
At the San Diego Convention Center, network access, screen power, AV equipment, and cable placement should be resolved before the demonstration is installed. The venue lists Smart City Networks for connectivity and ON Site Audio Visual for AV services; confirm the applicable ACE27 ordering arrangements. A tested offline or recorded version can preserve the explanation if the live connection fails.
Why Exhibitors Choose Circle Exhibit
Clear scope, transparent quote review, nationwide booth support, and efficient setup planning for qualified rental and custom exhibit projects.
48hr
Setup Window
10+
Years Since 2014
U.S.
Trade Show Support
Real
Booth Project Proof
A smart water demo needs room for a clear explanation, not necessarily more screens. Consider how long visitors stop, what they must see, and whether technical discussions can run without interrupting the presentation.
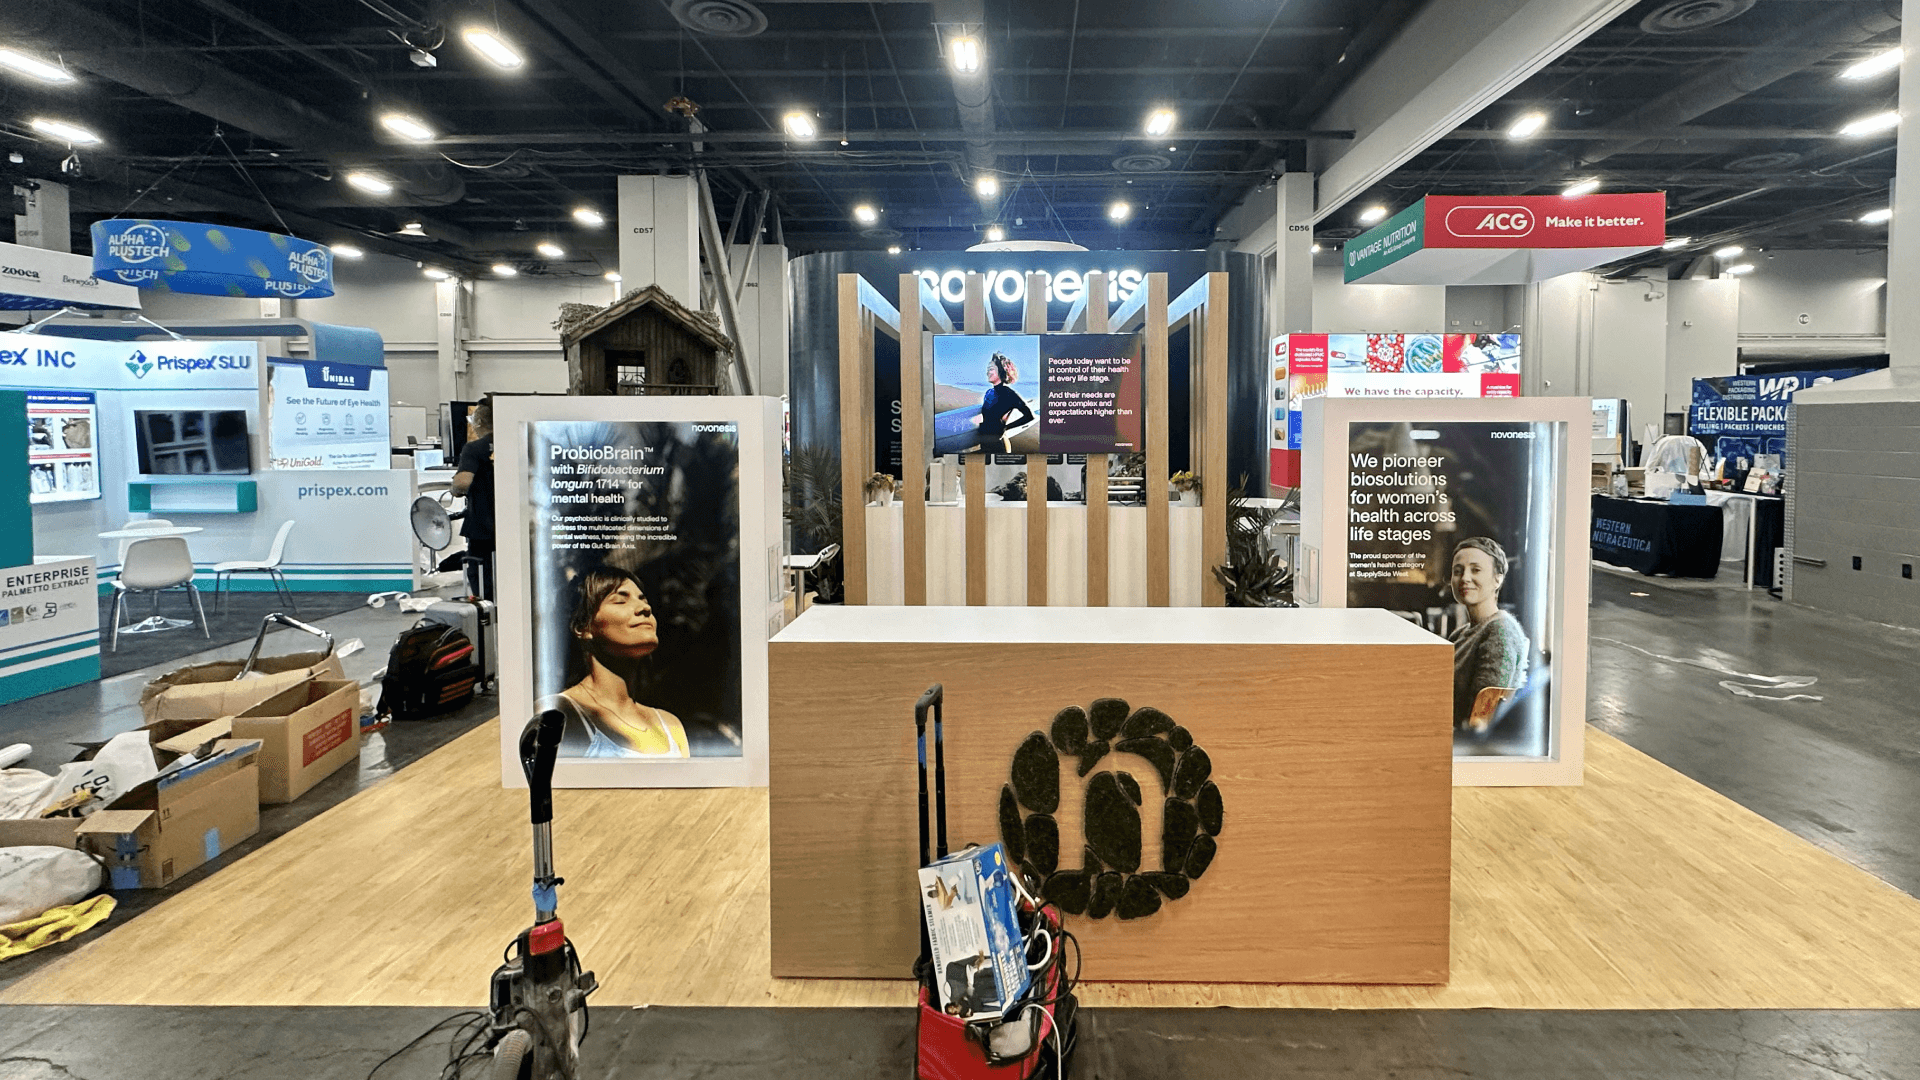
A compact booth can introduce one sensor or dashboard result. Keep the explanation brief and avoid crowding the viewing area with multiple screens or extended meetings.
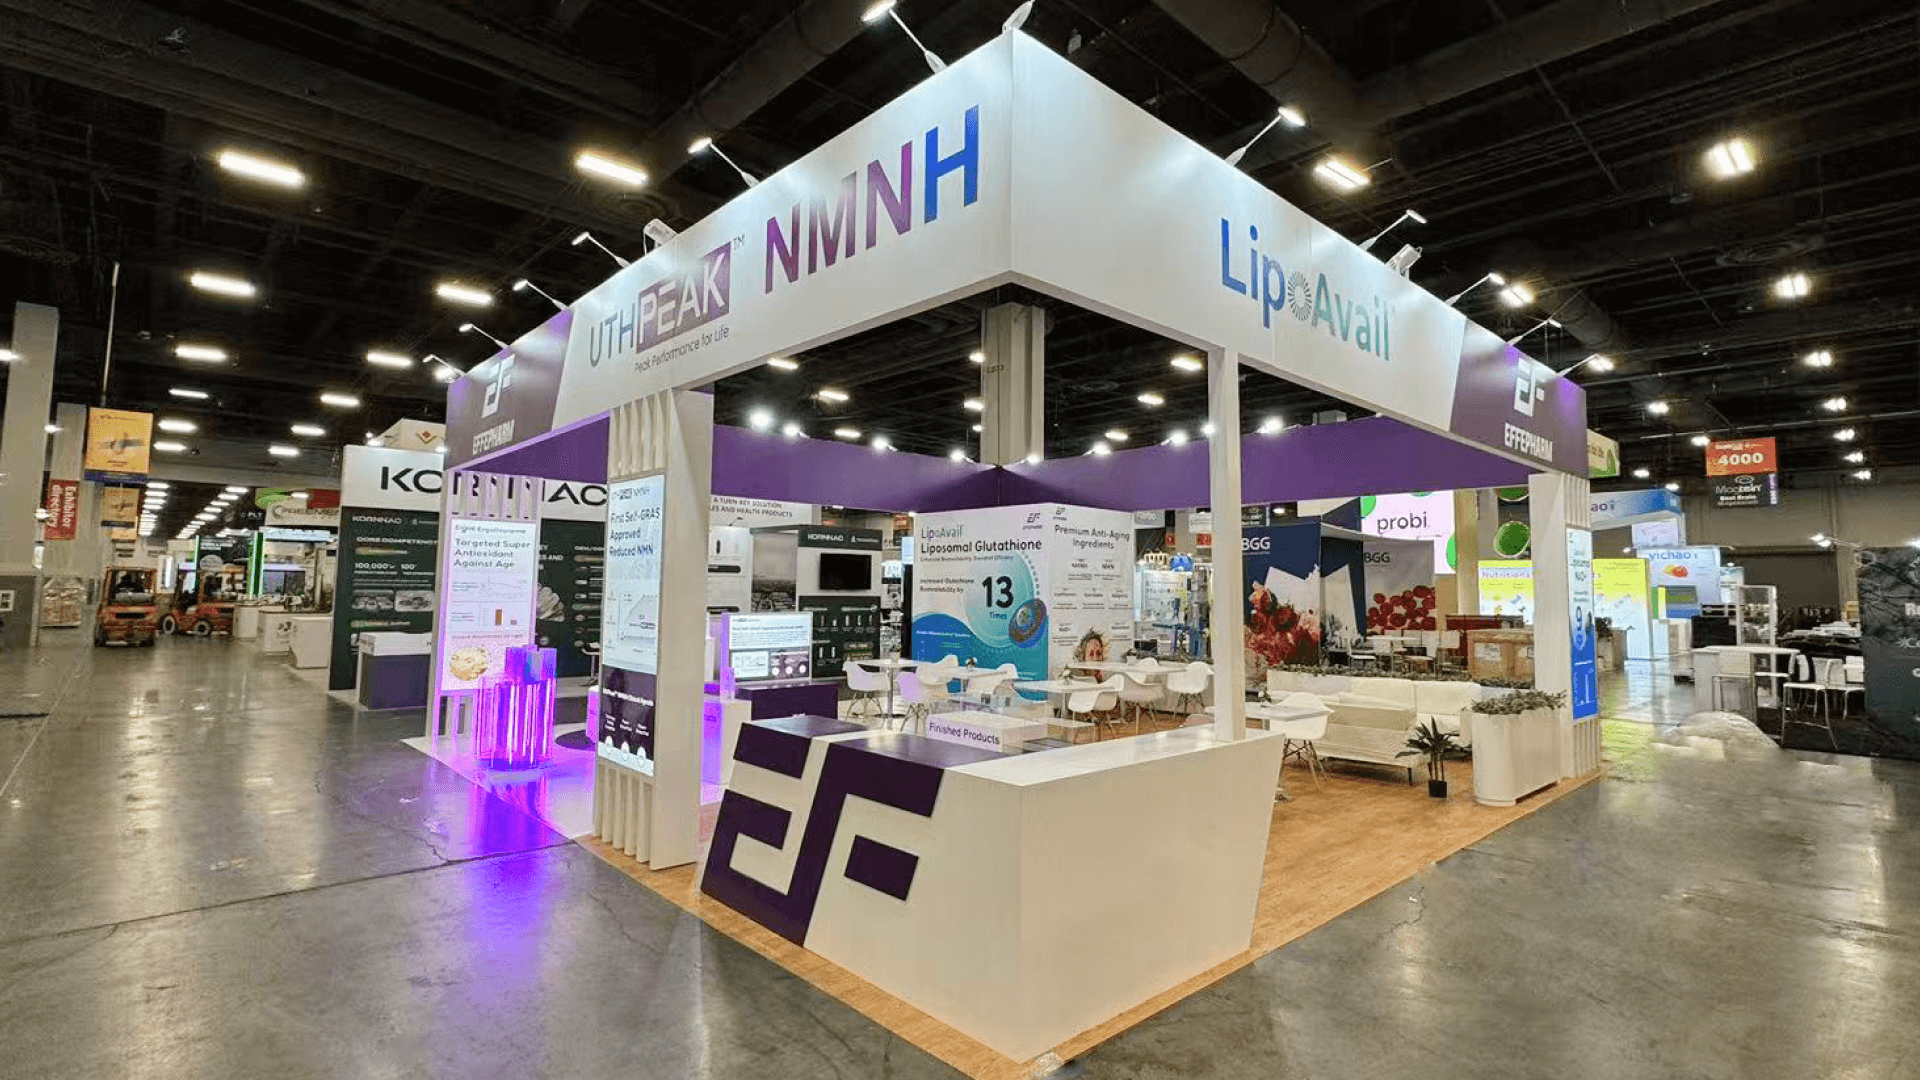
A 20x20 booth plan may separate the live demonstration from discussions about system interfaces or pilot requirements. The demo can continue while specialists speak with qualified buyers.
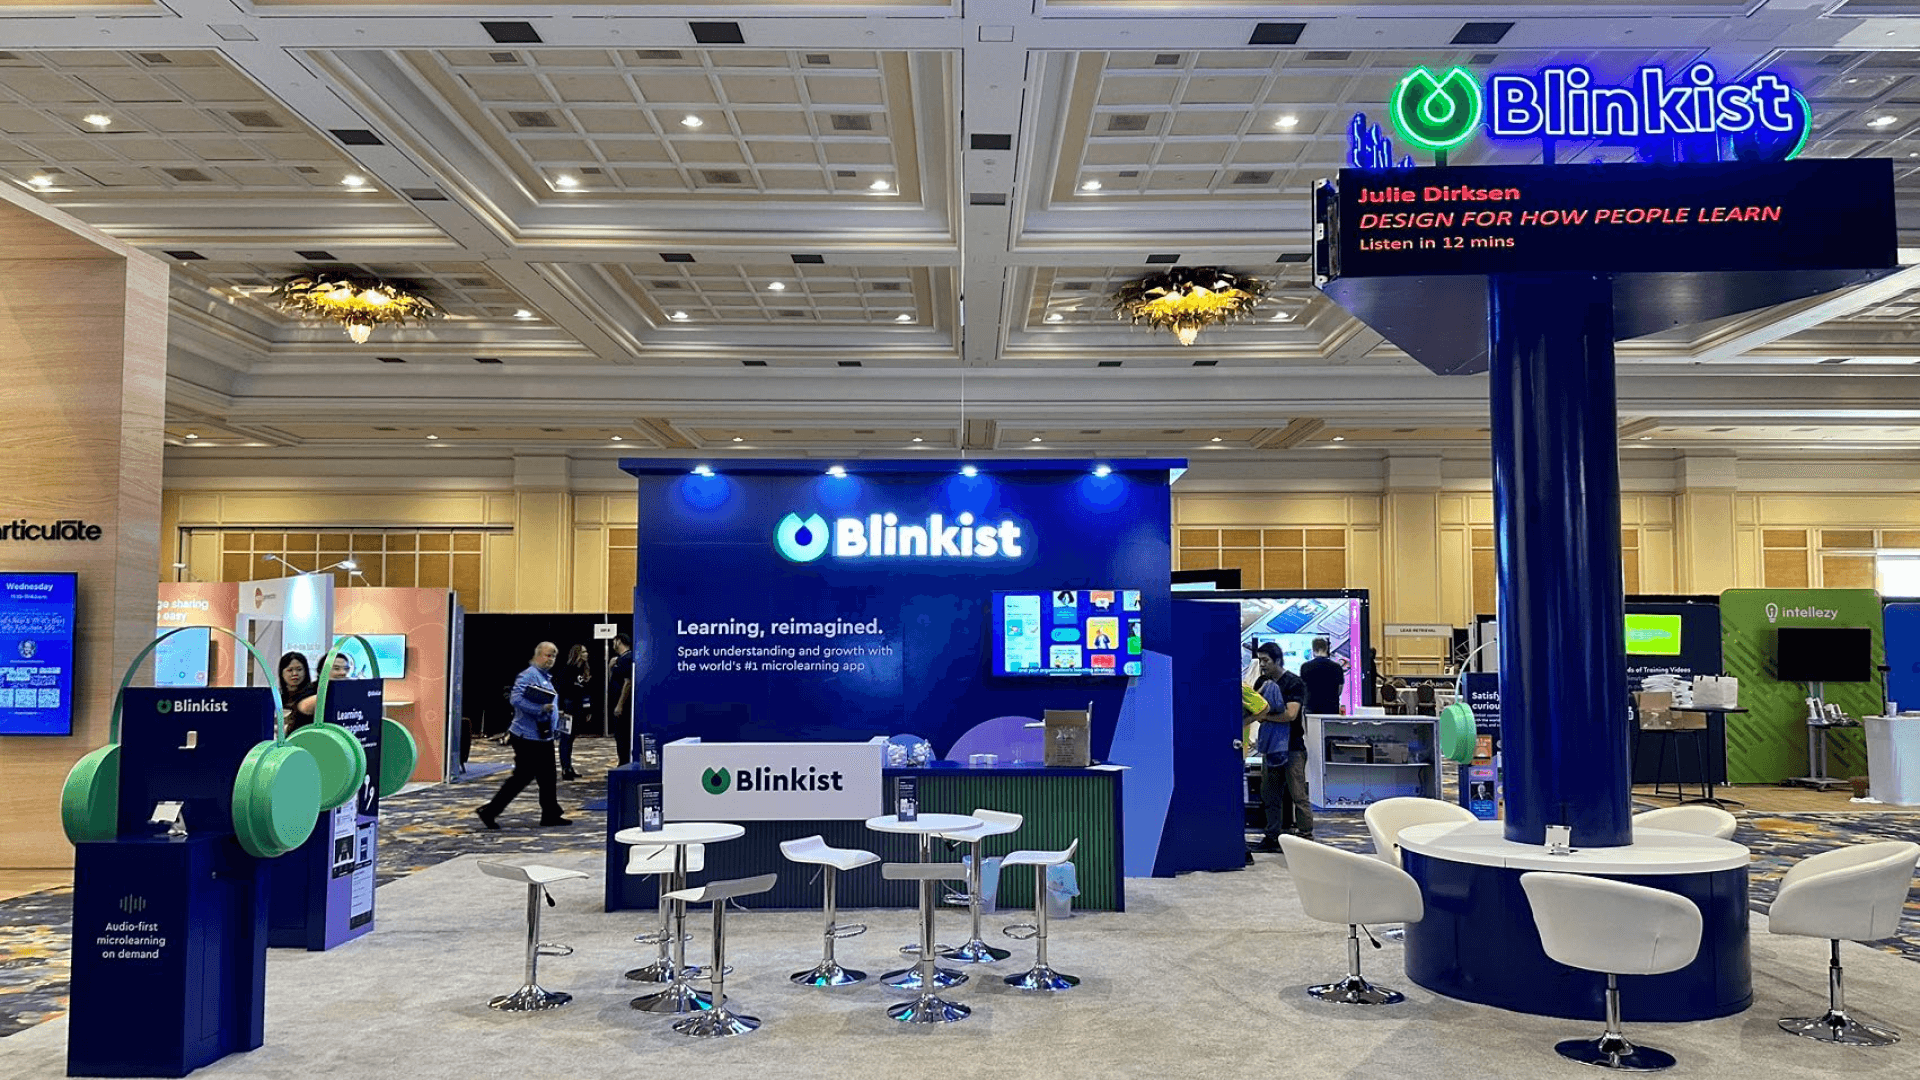
A 10x20 booth layout can accommodate the main screen, sensor context, presenter, and short questions. Visitors should be able to follow the sequence from one comfortable viewing position.
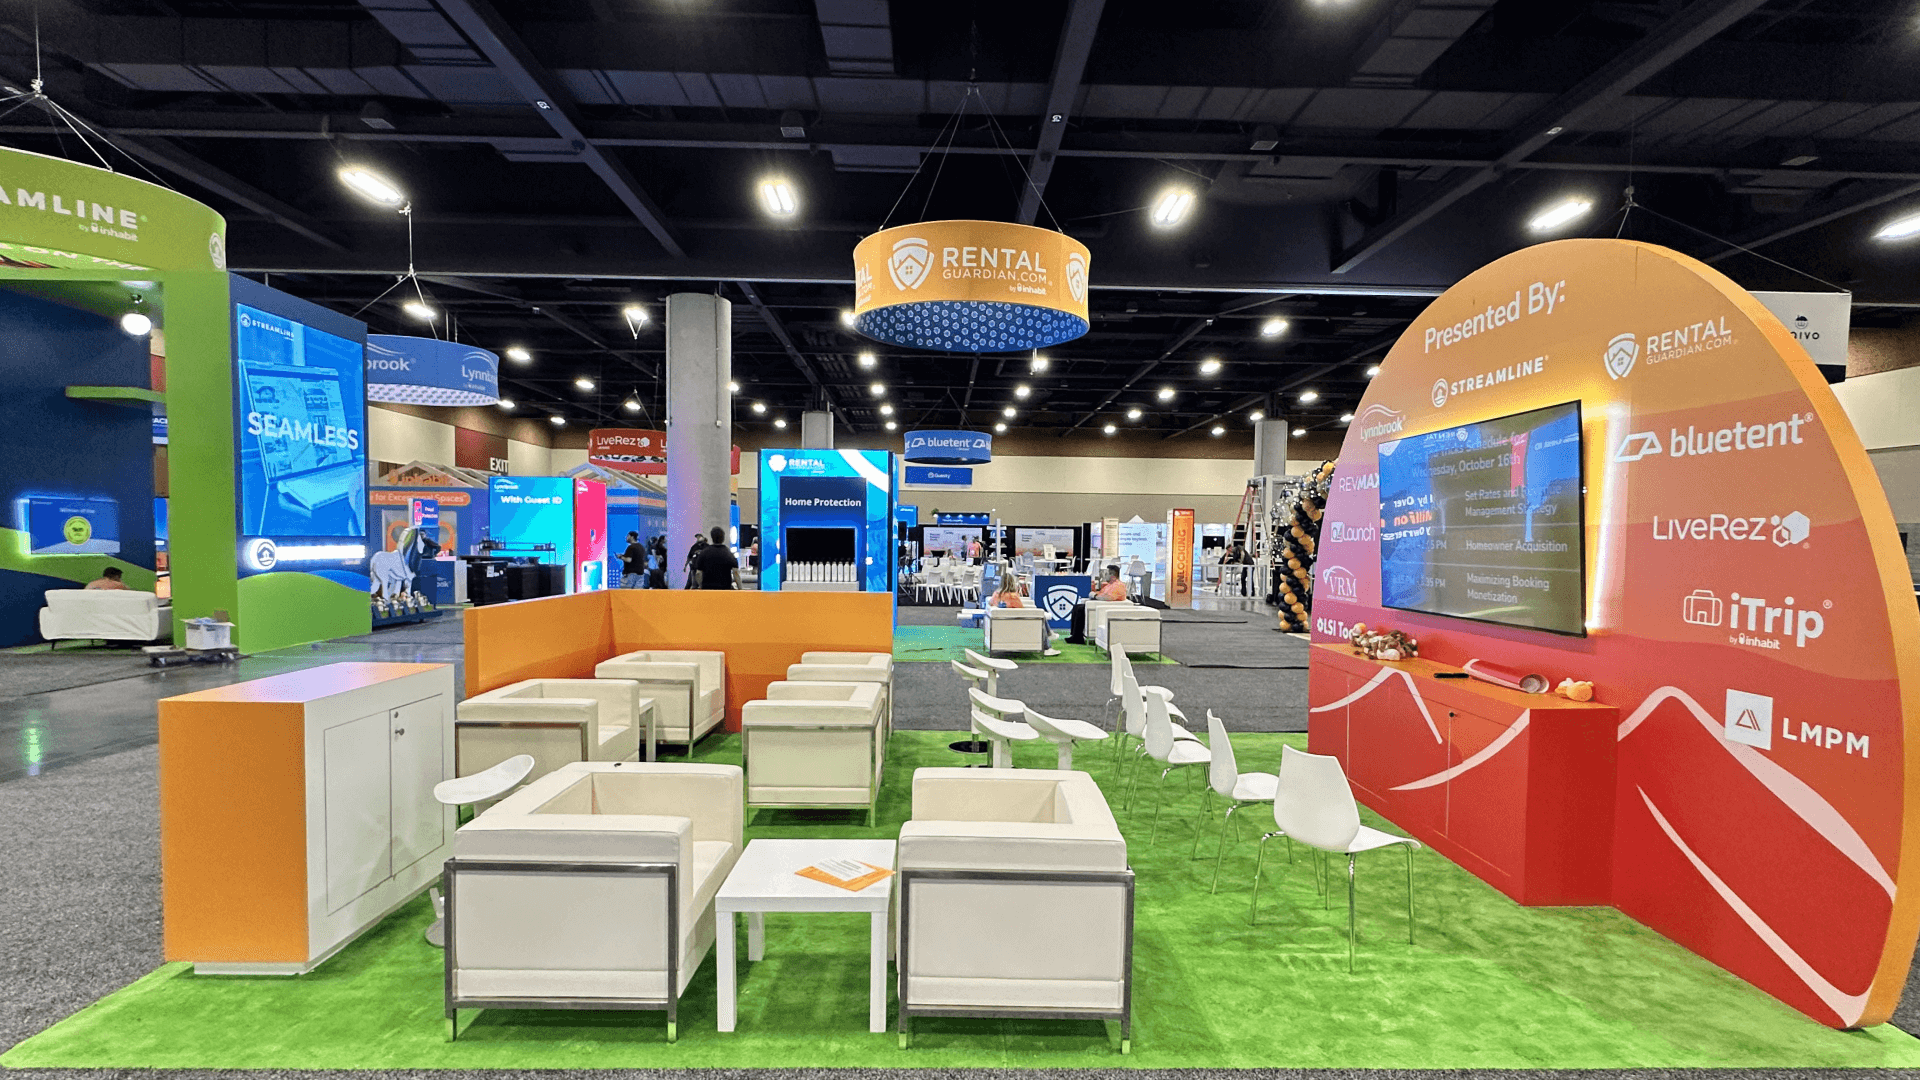
A larger booth can support two distinct workflows or groups with separate presenters. Each station should answer its own operating question rather than repeat the same dashboard.
Digital water solutions are easier for buyers to evaluate when demonstrations explain how data becomes operational insight. A focused smart water monitoring demo can help exhibitors organize workflow explanations, technical discussions, and buyer interactions around the value of the solution.
The presentation should show where the information comes from, what changes, and why the result matters. Every screen or physical sample must help explain that sequence.
Pair sensor hardware or a source diagram with a clear label identifying live, recorded, or simulated readings.
Present the values needed for the chosen monitoring example. Remove secondary charts that do not help explain the operating condition.
Show the condition that triggered the alert and what the information helps an operator investigate or decide.
Provide a nearby technical discussion point for interfaces, deployment conditions, data requirements, or pilot planning while the main demo continues.
This exhibit scenario connects field sensors, monitoring data, alerts, and utility operating decisions.
The parent ACE event runs June 13–16, 2027, at the San Diego Convention Center.
Technical buyers may assess data sources, alert logic, system compatibility, and the next steps for a potential deployment.
Not Sure Which Booth Size You Need?
Not every exhibitor knows whether a 10x20, 20x20, 20x30, or larger booth is the right fit. Circle Exhibit can help review your event goals, product display needs, demo areas, meeting space, storage, budget scope, and setup timeline before you choose a booth size.
Data Sources That Buyers Cannot Verify
Alerts Without Operational Context
1
Write One Monitoring Scenario
2
3
4
Rental for a Guided Monitoring Demo
A rental booth can accommodate a main screen, sensor samples, storage, and a technical discussion point. Review San Diego trade show booth rental when standard display components can support the presentation.
Custom for Specialized Demo Hardware
Custom work may be needed for proprietary enclosures, unusual mounts, or synchronized stations. Verify cable access, maintenance needs, and device replacement before finalizing the structure.
Hybrid for Repeatable Technology Demos
A modular exhibit can carry branding and meeting functions while dedicated hardware remains custom. Separate the reusable booth components from the technical equipment and its support requirements.
Record the displays, computers, sensor hardware, power needs, and cable routes. Verify the applicable services before the layout is finalized.
San Diego Convention Center lists Smart City Networks for exhibitor connectivity. Check the event ordering process and test whether the demonstration needs a dedicated connection.
Test the dashboard, accounts, alert sequence, and display visibility. Run the recorded or offline version completely, not just long enough to verify that it opens.
Check charged devices, login access, data state, and the correct starting screen each morning. Assign one person to verify readiness before exhibit hours.
Need a Booth Rental for Your Smart Water Demo?
A modular rental booth can bring sensor samples, monitoring screens, and technical discussions into one demonstration flow. Plan around screen placement, power, connectivity, and a tested backup so buyers can follow the workflow without interruption.
Does a pressure-monitoring demonstration need live field data?
No. Recorded or simulated readings can explain the workflow when accurately labeled. They should not be presented as proof of live performance.
How many screens does a monitoring demo need?
Does a successful dashboard demo prove field performance?
What if the network fails during the demonstration?
Is this an official ACE Innovation Hub exhibit category?
READY TO PLAN YOUR NEXT BOOTH?
Let’s Build a Booth That Fits Your Event
Share your event name, booth size, city, timeline, product display needs, and design references. Circle Exhibit will review your project direction and help you choose a rental-friendly or custom exhibit path.
3000+
Booth Projects Supported
50+
U.S. Event Cities
Transparent
Quote Review
Compare modular layouts for screens, sensor samples, storage, and technical discussions.
Plan a focused demonstration with one screen, sensor context, and a clear visitor position.
Make monitoring conditions, source labels, and alert explanations readable from the viewing area.
Coordinate screens, hardware mounts, counters, cable access, and the technical discussion area.
Review venue technology and AV service information before confirming the demo setup.