What Do Booth Traffic, Entry Rate, and Dwell Time Actually Measure?
Start by defining the action the booth should help a target visitor complete: enter, watch a demo, test a product, hold a meeting, or reach a qualified conversation. The same dwell time can represent useful technical testing in one booth and an unnecessarily slow process in another. Any comparison therefore needs a consistent counting area, time period, and visitor unit.
Metric | Working Definition | What It Shows | What It Does Not Prove |
|---|---|---|---|
Aisle traffic | Recorded passes or estimated unique visitors in a defined aisle area and period; label the unit | Exposure opportunity | Audience fit or attention |
Entry rate | Entry events ÷ eligible pass events, or unique entrants ÷ unique eligible visitors | Share of eligible traffic entering | Meaningful interaction |
Dwell time | Time per observed visitor in the booth or a named zone, summarized consistently | Where and how long visitors remain | Why they stayed |
Demo participation rate | Defined participants ÷ eligible visitors during active demo periods | Share participating in the demo | Buying intent |
Zone use | Count or share of booth entrants using a named area | Which areas receive use | Reason or value of that use |
Staff interaction rate | Unique entrants receiving staff interaction ÷ unique booth entrants | Share receiving staff contact | Conversation quality |
Entry-to-conversation rate | Unique entrants reaching a qualified conversation ÷ unique booth entrants | Overall entry-to-qualification conversion | Opportunity creation |
Staff qualification rate | Unique visitors reaching a qualified conversation ÷ unique visitors who interacted with staff | Qualification within staff contacts | Why uncontacted visitors leave |
Meeting completion rate | Completed meetings ÷ meetings scheduled for the measured period | Whether planned meetings occur | Meeting quality or outcome |
Specify whether aisle traffic counts pass events or unique visitors, then keep that unit consistent through the related rate. Record multiple entrances separately before combining them. Demo participation also needs a clear definition: a peripheral viewer, an intentional watcher, and a hands-on tester are not interchangeable. If an aisle-facing demo attracts people who never enter, use a denominator that includes those eligible viewers rather than relying only on booth entries.
Entry-to-conversation rate and staff qualification rate measure different transitions. Meeting completion is different again because it applies to scheduled meetings, not to every visitor entering the booth.
Badge scans identify only the visitors recorded by staff; they do not represent everyone who passed, entered, or watched. A useful trade show lead capture process adds the context a badge record lacks: why the visitor stopped, what should happen next, and who owns the follow-up. Only compare tools or shows after aligning their definitions and counting conditions.
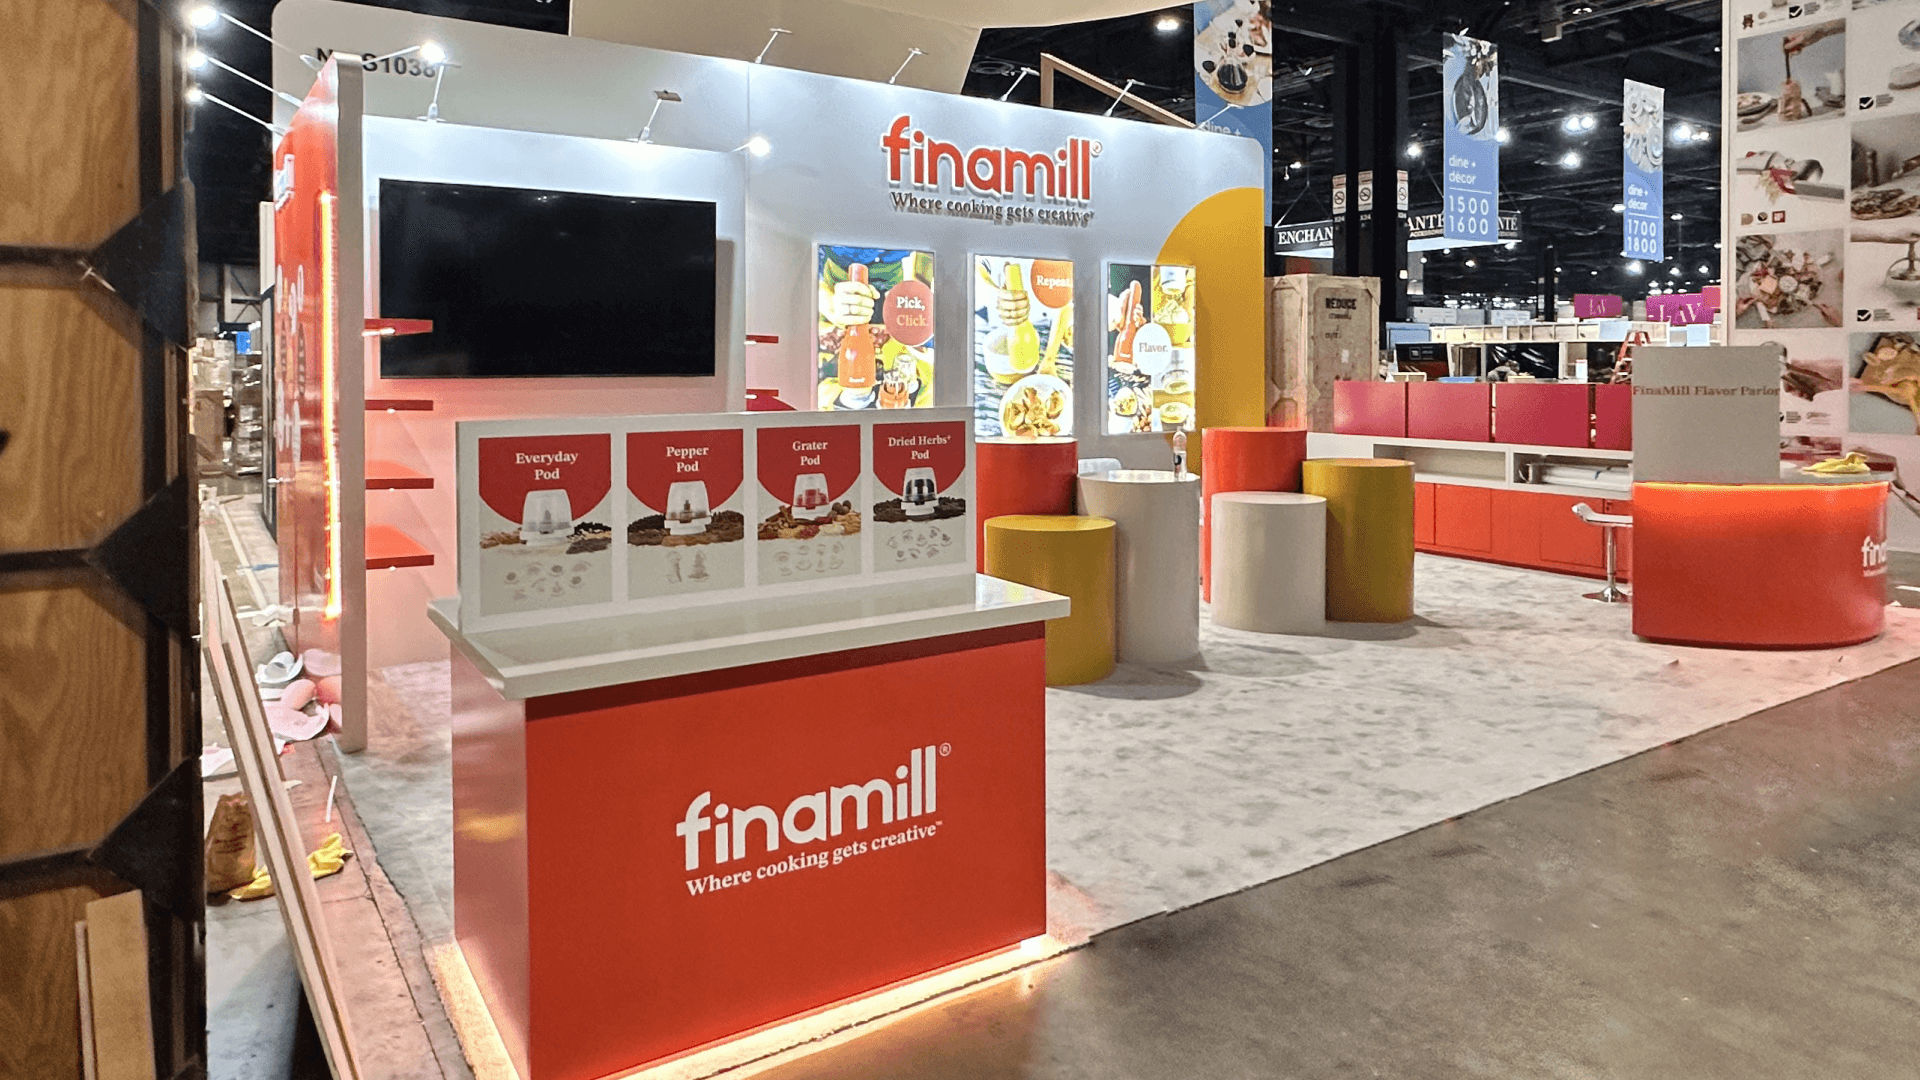
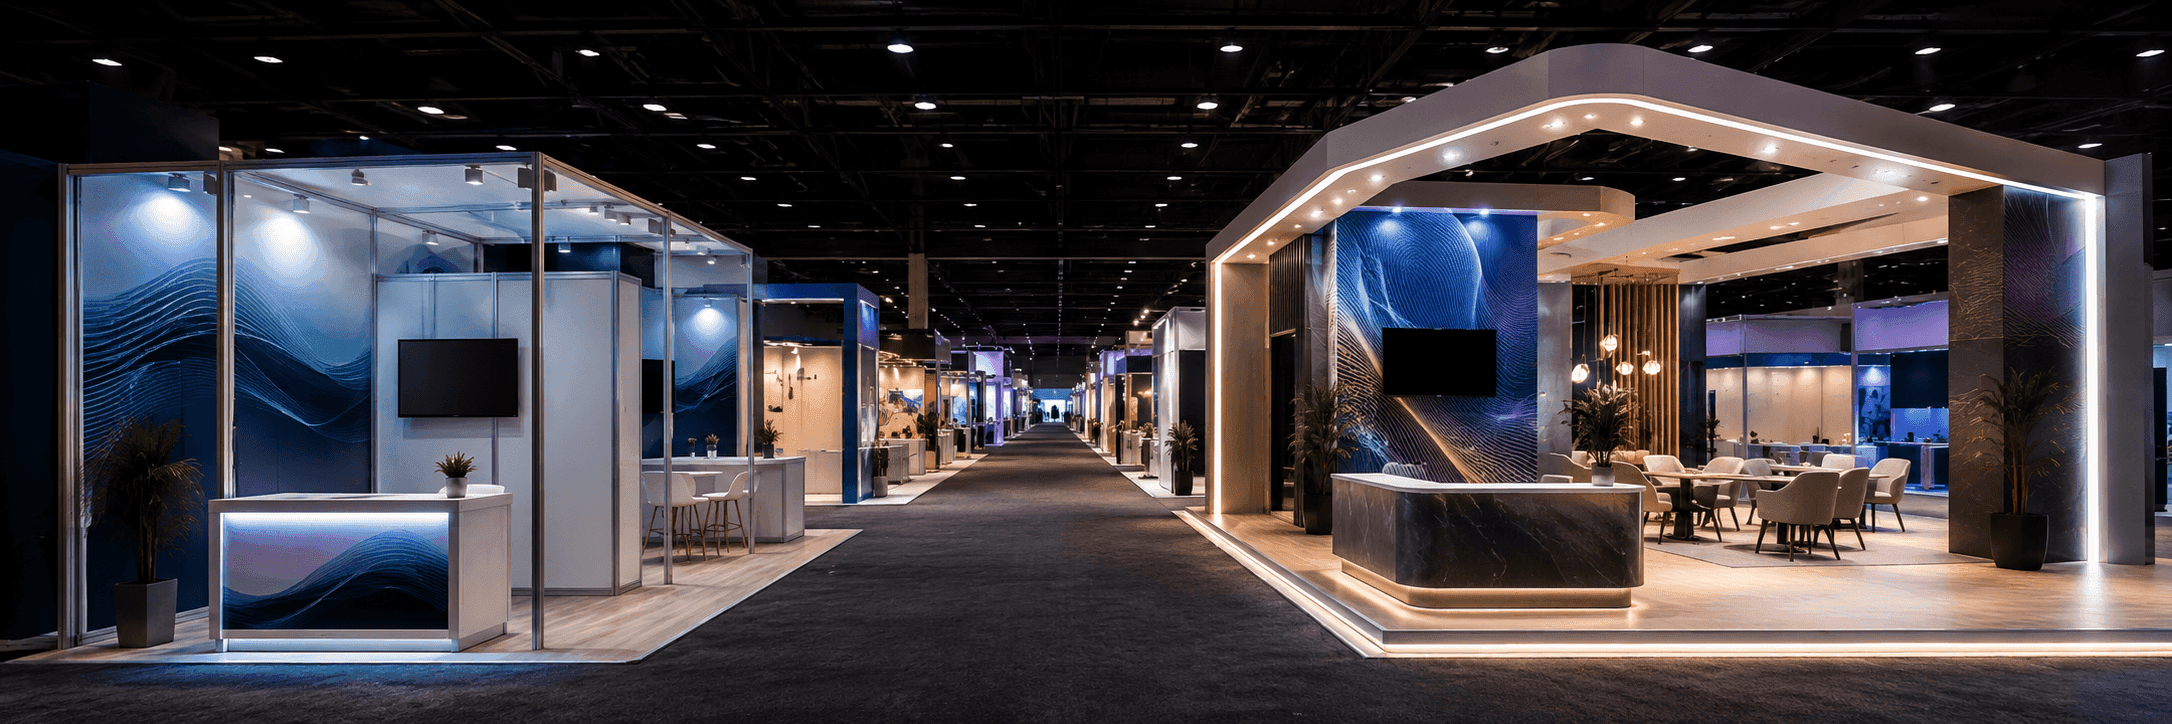
A 20×30 booth layout showing how visitors move from the aisle into product demonstrations and staff conversations.
Where Does Visitor Progress Slow Down?
Here, “high” and “low” are relative to an internal baseline—different entrances, comparable time blocks, before-and-after results, or a previous show measured the same way—not to a universal industry benchmark.
Observed Pattern | Possible Explanation | What to Verify | Adjustment to Test |
|---|---|---|---|
High aisle traffic, low entry rate | Unclear first focal point, obstructed entrance, or an aisle audience that does not match the target visitor | Approach direction, product visibility, counter position, and staff position | Reorient the message, entrance, or reception point |
High entry rate, short dwell time | Intended quick task, unclear first step, or missed staff response | Whether visitors complete the intended action before leaving | Keep it if the task is completed; otherwise clarify the first interaction |
High entry rate, low staff interaction | Intended self-service, occupied staff, or staff hidden by crowds | Whether staff contact is required, along with coverage and handoff responsibility | Preserve useful self-service or reposition staff |
Long dwell, low demo participation | Another useful activity, waiting, resting, or congestion | Where visitors remain and what they are doing | Leave useful activity alone or separate waiting from the demo area |
High demo participation, few qualified conversations | Broad demo audience, weak handoff, or no suitable place to continue | Participant fit, demo exit, staff ownership, and discussion position | Refine the audience message, handoff, or conversation point |
Low meeting-area use | Few bookings, poor access, excess allocation, or deliberately reserved capacity | Booking volume, peak use, privacy needs, and access path | Retain it when justified; otherwise repurpose, move, or resize it |
Heavy traffic in one zone | A popular interaction or a developing bottleneck | Queue formation, entry and exit speed, and adjacent circulation | Change capacity, location, or demo cadence |
These patterns show where to look, not what caused the problem. Hall position, neighboring exhibitors, session schedules, breaks, giveaways, staff coverage, and audience fit can produce similar results. Compare the numbers with direct observation, then test one meaningful change during a similar period.
Repeated conflicts across several zones often point to a broader booth size and visitor flow problem, not a single misplaced counter or staff position.
When Does Longer Dwell Time Show Engagement—and When Does It Show Friction?
A longer stay means little until you know where it happened and what the visitor was doing. Someone may stay to watch a complete demonstration, test a product, or speak with a technical or sales specialist. Those activities may be exactly what the booth was designed to support.
A similar duration can come from waiting for a demonstration, queuing for another area, using a lounge, searching for the next step, or being delayed by a blocked entrance or exit. Dwell time alone cannot distinguish between those situations.
Use three questions:
Where did the dwell occur? Identify the demo, testing area, meeting space, lounge, queue, or circulation path.
What was the visitor doing? Separate watching, testing, talking, waiting, resting, and searching for direction.
What happened next? Check whether the visitor moved into another useful action.
There is no universal number of minutes that identifies a high-quality visitor. For a presentation area, the live demo booth layout must leave enough room for visitors to watch, participate, exit, and allow staff to reset the demonstration.

Small changes to the entrance, demo position, and staff placement can improve traffic flow and create more productive engagement.
A 20x30 Example: High Traffic but Weak Follow-Through
Take an illustrative 20×30 island booth with two main approach directions, one public demo area, a reception counter, a meeting area, and four staff members. Main-aisle traffic is high, but one entrance has a noticeably lower entry rate. Visitors remain near the demo, few continue into staff conversations afterward, and the meeting area is rarely used.
At first, the team assumes that the weaker entrance is not open enough. The numbers identify where visitor progress slows, but they do not explain why. On-site observation tells a fuller story: the reception counter and demo audience narrow the approach, while the greeter stands behind the crowd. Visitors arriving from that direction struggle to see both the product and an available employee.
Before changing the structure, the team moves the greeter forward, redirects the queue, and assigns one employee to receive visitors after each presentation. Staff then measure the same behaviors during a comparable time block. A change in entry or post-demo interaction would suggest that positioning and handoff contributed to the problem, but it would not prove that the counter must be rebuilt.
If the obstruction, missed handoffs, and low meeting use continue across several comparable periods, the next design can open the entrance, move the counter, provide more viewing and exit room, and reconsider the meeting allocation. Those requirements provide a better basis for choosing among 20x30 rental designs, because the team can evaluate each option against the same demo, reception, meeting, and storage needs.
What Can Change During the Show—and What Belongs in the Next Booth Design?
Changes You Can Test During the Show
Staff positions and responsibilities can change without rebuilding the booth. Assign clear greeter, demo lead, and qualifier roles, or test a different reception approach at each entrance. Demo timing, queue direction, and simple wayfinding can also be adjusted while the show is running.
Change one main condition at a time and compare similar periods. Record outside influences such as conference sessions, scheduled breaks, or neighboring presentations, then measure the same visitor actions again using the original definitions. A better result makes the change worth testing further; it does not prove causation after one time block.
Changes That Belong in the Next Booth Design
Recurring evidence—not one busy hour—may justify changing entrance openness, counter size or position, demo capacity, meeting allocation, storage, staff circulation, overall booth size, or the number of open sides. It may also show that public interactions and meeting access need separate routes.
Persistent conflicts caused by low-use furniture or zones can indicate that a simpler booth design would serve the main visitor task more clearly. Only recurring path, capacity, or functional conflicts should enter the next design brief; analytics narrows the investigation, while observation and repeat measurement under comparable conditions help confirm the explanation.
Conclusion
Aisle traffic describes the opportunity to be seen, while entry rate shows how much eligible traffic moved inside. Dwell time becomes meaningful only when it is tied to a place and an activity. Demo participation, staff interaction, completed meetings, and qualified conversations then show whether visitors continued toward the booth’s intended outcome.
Together, these measures show where the team should investigate next. Once those onsite actions are recorded consistently, the team can measure booth ROI by connecting qualified activity with opportunities, attributed financial outcomes, and the full cost of exhibiting.
Frequently Asked Questions
What is a good dwell time for a trade show booth?
There is no fixed number that works for every booth. Judge dwell time against the visitor task, demo length, location, and next action. A hands-on product test may reasonably take longer than a brief qualification conversation. What matters is whether the time supports the intended interaction without adding avoidable waiting or congestion.
Should booth entry rates be compared across different trade shows?
Only when the counting method, entrance definition, booth objective, and surrounding conditions are sufficiently similar. Even then, the result provides context rather than a universal benchmark. Comparisons between entrances, comparable time periods, or conditions before and after a change within the same booth are usually more reliable.
Should multiple booth entrances be measured separately?
Yes. Each entrance may face different traffic volumes, sightlines, neighboring exhibitors, and physical obstructions. Separate measurements show whether weak entry or congestion is concentrated in one direction. Combine the results only after confirming that the visitor units, time periods, and entry definitions are compatible.